Physiochemical properties of a model shortening with trans-free and low-saturated fatty acid
Ibtesam I. Ahmed1*, Manal A. Sorour2, Mohamed S. Abbas2, Amira Sh. Soliman2
1 Food Engineering and Packaging Department, Food Technology Research Institute, ARC, Egypt. 2 Natural Resources Dept., Faculty of African Postgraduate Studies, Cairo Univ., Egypt.
ABSTRACT
Soybean oil (SO) and fully hydrogenated soybean oil (FH) blends as a trans-free with different ratios 40:60 (F4S6) and 45:55 (F45S55) were prepared as an alternative to partial as alternative to partially hydrogenated for manufacturing shortening, margarine and confectionary . Rheological properties of different samples of soybean oil, partially hydrogenated soybean oil (PH), and the blend of (SO) and (FH) were measured using Brookfield rheometer at different shear rates and temperatures. The results revealed that soybean oil at low temperatures had shear thickening behavior, while at high temperatures exhibited shear thinning behavior. Partially hydrogenated soybean exhibited shear thinning at different temperatures (1, 10, 20, 30, and 40 ℃), and shear thickening at temperatures 50 and 70 ℃. Meanwhile, F4S6 and F45S55 exhibited shear thickening behavior for all temperatures studied. The viscosity decreased with increasing temperature and displayed shear thinning. The activation energy was determined using Arrhenius law. Chemical properties (Peroxide value, Acid value, saponification number, and iodine values) of different samples were determined. The results revealed that the lowest peroxide value was for FH. However, the lowest saponification number and iodine value were for partially PH.
Keywords: Fully Hydrogenated Soybean Oil, Partially Hydrogenated, Rheological Properties of oil, Arrhenius Law, chemical properties, soybean oil
Introduction
Soybean is considered the first source of high-value and the secondary co-products as anti-oxidant, vitamins, lecithin, nutraceuticals [1], and phytoestrogens [2]. Its oil is among the most commonly used oils [3, 4]. Soybean oil was a good source of Poly-unsaturated fatty acid, ω -6, and ω -3 fatty acids without any traces of trans fatty acid [5]. On the other hand, to increase the melting point of soybean oil (SO) we have to mix it with FHSO, which also is considered trans free. Hence, a binary mixture of SO was used as an alternative to partial hydrogenation for manufacturing shortening, margarine, and confectionary [6, 7].Hydrogenation is often done partially for the formulation of functional shortenings and confectionary coting with the hydrogenated vegetable oils.
However, during partial hydrogenation of vegetable oils, around 50% of trans fatty acids are formed because some of the cis double bonds isomerize their trans forms [8, 9].
Trans fatty acids were studied to know the effects on metabolic functions, resulting in altered cell membrane integrity and reduction of biologically active metabolites [10, 11].
Increasing trans fatty acid rates were limiting factors for D-Trans fatty acid formation and have has greater stability and higher melting points comparing with cis fatty acid. Cis fatty acids have a kinked shape causing difficulty to pack their molecules together. Meanwhile, trans-fatty acids represent a linear shape which makes it easier to pack their molecules [12, 13].
Several nutritional studies have suggested a correlation between present trans fatty acid and coronary heart diseases [14, 15]. The negative health impact associated with TFA is raising low-density lipoprotein with the increasing and decreasing high-density cholesterol [16, 17]. The negative health impact associated with TFA is raising. Replacing 5% of saturated fatty acids from our daily energy intake would reduce the risk of cardiovascular diseases in the range of 22-37% [18, 19].
In 2003, United States Food and Drug Administration (FDA) and The American Heart Institute required mandatory labeling of trans fats on the Nutrition Fact labels on packaged food to inform the consumer about the heart risk of eating it. The consumer should be aware that the products contain 0.5 grams of trans fatty acid still are labeled as “Zero gram of trans fat”. However, less than 10% of the daily energy from saturated and trans fats are allowed to be consumed [20].
On November 8, 2013, a preliminary judgment was made by FDA that partially hydrogenated oils could not be considered "generally recognized as safe" (GRAS). The final determination was released On June 18, 2015, that partially hydrogenated oils are not GRAS. By June 18, 2018, all manufacturers have to remove all partially hydrogenated oils from foods [18].
Rheology is a part of mechanics that studies the deformation and flow of matter in response to an applied stress. The capacity to undergo extensive flow, but yet exhibit a substantial solid character is a desirable material property for essentially all industrially useful fat systems [16].
The rheological properties of edible oils are of great importance for their handling in the food industry and are a powerful tool to understand the structural changes occurring after oil processing. One important, primary rheological property is the dynamic viscosity (resistance of a fluid to flow) [16].
Oils and fats play essential roles in health and are a compact source of energy and fat-soluble vitamins. Additionally, the role of essential fatty acids in the body is proved and the body can not do those itself without using vegetable oils. They improve food properties and facilitate heat transfer [21].
The present study aimed to investigate the physicochemical properties of shortening as a blend of soybean oil, partially and fully hydrogenated soybean oil with different ratios for the production of shortening trans free and low saturated fatty acid.
Material and Methods
Materials
Soybean oil and partially hydrogenated soybean oil were purchased from Safola oil company, Suez-Egypt, while fully hydrogenated soybean oil was purchased from General Mills Company-Canada.
Methods
- Samples Procedure
Samples were prepared by blending different proportions of FH: SO (45:55) by weight and then heated up to 70°C and crystallized under different shearing rates (0, 25, 200, 400, and 800 s-1). The crystallization was conducted by cooling down at three end temperatures (1, 10, and 20°C).
- Rheological properties of samples
Brookfield rheometer DV III Ultra was used to measure the apparent viscosity of (SO), and a blend of SO and FH with different ratios (F4S6& F45S55) compared with PH as a commercial one. Samples were placed in a small sample adapter; the SC4-21 spindle was selected for measurement. A thermostatic water bath was provided with the instrument to regulate the sample temperature. The rheological parameters for samples were measured at temperatures 1, 10, 20, 30, 40, 50, 60, and 70℃[22].
- Chemical analysis of shortening
- Iodine value
Fat or oil is mixed with iodine monochloride solution to halogenate double bonds in fat or oil. Excess iodine monochloride is reduced to free iodine in the presence of potassium iodine, and free iodine is measured by titration with sodium thiosulfate using starch as an indicator. Iodine value measured as mg iodine absorbed per g of sample (5 iodine absorbed), is a measure of the unsaturation of fats and oils.
- Peroxide value
0.5 g of all samples in the test portion was added into 250 ml glass-stopped Erlenmeyer. 30 ml CH3COOH-CHCL3 was added and swirled to dissolve. 0.5 ml saturated KI solution was added and let stand with occasional shaking for 1 min, and 30 ml H2O was added. Then, it was slowly titrated with 0.1 M Na2S2O3 with vigorous shaking, until the yellow color was almost gone. 0.5 ml of 5 starch layers were added until the blue color was just disappeared. If ≤ 0.5ml 0.1M Na2S2O3 was used, the determination was repeated with 0.01 M Na2S2O3. The blank determination was conducted daily (it must be 0.1 mL 0.1M Na2S2O3). It was subtracted from test portion titration.
Peroxide Value (PV) = mille equivalent peroxide/kg oil or fat
PV=S*M*1000/g test portion
Where:
S= ml Na2S2O3 blank corrected
M=molarity Na2S2O3 solution.
- Saponification number
According to the AOAC official method [23], 5 g fat sample was added into 250-300 ml Erlean, and 50 ml alcoholic KOH solution was added into the flask. The flask was connected with air condenser and boiled for 30 min until the fat was completely saponified. Then, it was cooled and titrated with 0.5 M HCL using phenolphthalein. The blank determination was conducted on the test portion, using the same pipet for measuring KOH solution and draining for the same time. saponification number was calculated from the following equation:
mg KOH required to saponify 1g fat = 28.05(B-S)/g oil
Where:
B= ml 0.5 M required by the blank
S= ml 0.5M HCL required for test portion.
- Acid value
7.05g well-mixed oil was added to 50 ml alcohol in a clean, dry 150 ml flask, and drops of the oil and 2 ml phenolphthalein were added. The flask was placed in H2O at 60-65℃ to warm, and enough 0.1 M NaOH was added to produce faint permanent pink. 56.4g oil was added into the neutralized alcohol and titrated with 0.1M NaOH, vigorously shaking mixture until the same faint permanent pink appeared in supernate alcohol. Multiply ml 0.1 M NaOH by 0.05 and report as percent free fatty acids expressed as oleic acid.
Acid number determine as a Free fatty acids may also expressed in terms of equal value (mg KOH necessary to neutralized 1 g oil).
Results and Discussion
Rheological Properties of Different Samples
Physical properties of vegetable oils such as viscosity are important engineering parameters and have big roles in designing equipment [24]. Rheological properties of soybean oil (SO) and fully hydrogenated soybean oil (FHSO) were determined using a Brookfield rheometer. High viscosity means that the liquid will not flow easily and vice versa. Figure 1 shows the effect of shear rate on the apparent viscosity of soybean oil at different temperatures. The results revealed that apparent viscosity was high at low temperatures (1℃) due to the presence of unsaturation in molecules and its structure [25]. Apparent viscosity decreased with increasing shear rate at temperatures 30, 40, 50 and 70℃ indicating shear thinning behavior, while at 1, 10, and 20℃ the viscosity was regularly decreased as increasing temperature,because with increasing temperature, breaking of double bonds in the molecule will take place due to this intermolecular force of attraction decreases [26]. Apparent viscosity of soybean oil samples increased with increasing shear rate indicating shear thickening behavior.
Figure 2 shows the effect of temperature on the consistency index and flow behavior index. The results revealed that the consistency index increased as temperature increased till it reached its maximum point at 50 ℃, then decreased, while the flow behavior index didn’t give a good trend.
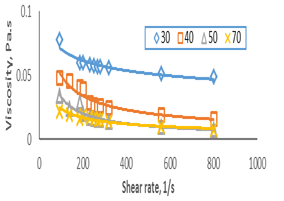
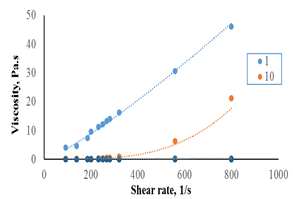
Figure 1: The relationship between shear rate and viscosity for the SO.
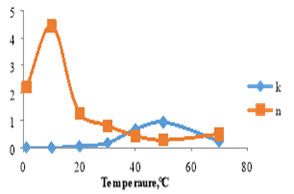
Figure 2. Consistency index and flow behavior index as affected by increasing temperature for soybean oil.
The effect of shear rate on the apparent viscosity of partially hydrogenated soybean oil was shown in Figure 3. The results revealed that apparent viscosity increased as shear rate increased at temperatures 1, 10, 20, 30, 40°C indicating shear thickening behavior, while at temperatures 50 and 70°C apparent viscosity decreased as shear rate increased indicating shear thinning behavior.
Figure (4) shows the effect of temperature on the consistency index and flow behavior index. The results revealed that the consistency index increased as temperature increased, while flow behavior index didn’t give a good trend.
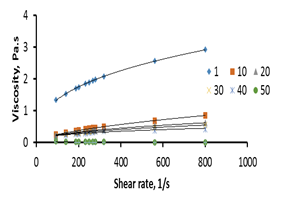
Figure 3. Relationship between shear rate and viscosity for partially hydrogenated (PH) soybean oil.
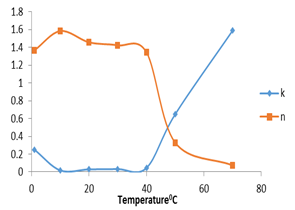
Figure 4. Consistency index and flow behavior index as affected by increasing temperature for PH.
Meanwhile, the viscosity values (Pa.s) versus shear rate (1/s) for the F4S6 are shown in Figure 5. The results revealed that as the shear rate increases, the viscosity increases, indicating that the flow of shortenings is shear thickening behavior (dilatant behavior).
Figure 6 shows the effect of temperature on the consistency index and flow behavior index. The results revealed that the consistency index decreased as temperature increased, while the flow behavior index remained constant till it reached 70℃, then decreased; this means that F4S6 decreased its dilatant behavior and it was near to pseudoplastic at 70℃.
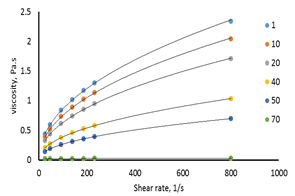
Figure 5. The relationship between shear rate and viscosity for 40:60 (F4S6).
Figures 7-a, b show the effect of shear rate on the apparent viscosity for F45S55. The results revealed that apparent viscosity increased with increasing shear rate indicating shear thinning behavior at all temperatures studied.
Figure 8 shows the effect of temperature on the consistency index and flow behavior index. The results revealed that the consistency index increased at 1 and 10℃ then decreased as temperature increased from 20 to 70℃. Flow behavior index remained higher than one at temperatures 1 to 30℃ then decreased at 40, 50, 60, and 70℃; this means that F45S55 was shear thickening at low temperatures and shear thinning at high temperatures.
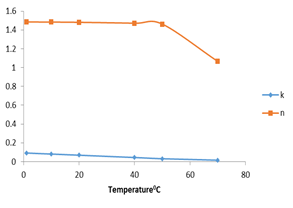
Figure 6. Consistency index and flow behavior index as affected by increasing temperature for F4S6.
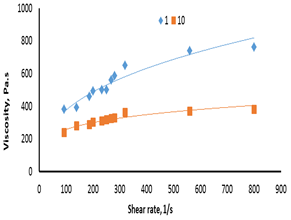
Figure 7-a The relationship between shear rate and viscosity for F45S55 at 1 and 10°C.
Effect of Temperature on Apparent Viscosity
Temperature is an important parameter that has an effect on rheological as heat affects the chemical exchanging and has strong effects on the viscosity of fluids. In many food operations, viscosity-time interactions are required. Soybean seed composition was affected by geographic and environmental factors [27]. Soybean oil is more variable than protein from year to year26].
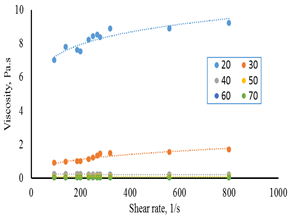
Figure 7-b the relationship between shear rate and viscosity for 45:55 (F45S55) at 20-70°C.
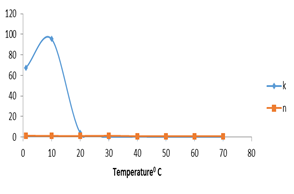
Figure 8.Consistency index and flow behavior index as affected by increasing temperature for F45S55.
The effect of temperature on the apparent viscosity of soybean oil was shown in figure 9. The results revealed that viscosity increased at low temperature (1℃) and remains constant at temperatures from 10 to 70℃; this may be due to the fact that viscosity is a coefficient of temperature and various factors [26].
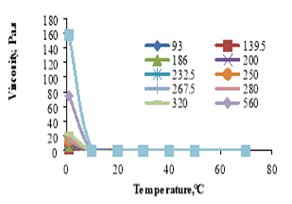
Figure 9. Effect of temperature on the apparent viscosity of soybean oil.
The effect of temperature on apparent viscosity for partially hydrogenated soybean oil was shown in figure 10. Viscosity decreased with increasing temperature at all shear rates. Also, fluctuations in viscosity were observed over a certain temperature range. Fluctuations could be associated with the local agglomeration of the dispersed solid particles around the spindle and increase in viscosity.
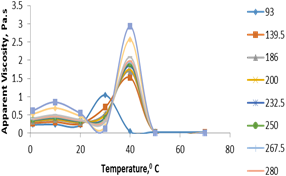
Figure 10.Temperature effect on the apparent viscosity of partially hydrogenated soybean oil.
The effect of temperature on the apparent viscosity of F4S6 and F45S55 was shown in figures 11 and 12. The results observed that apparent viscosity decreased sharply with increasing temperature. Also, the apparent viscosity of F45S55, decreased with increasing temperature till it reached 20℃ then remained constant at temperatures from 20 to 70℃. In fact, the dispersed phase of F4S6 is uniformly distributed could be verified fluctuations in viscosity decrease at ratio 40:60 where the curves tend to be smooth.
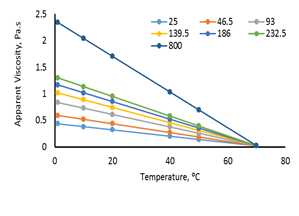
Figure 11.Temperature effects on the apparent viscosity of F4S6.
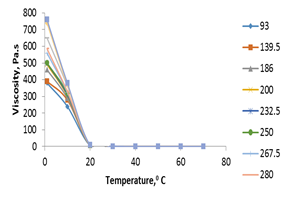
Figure 12.Temperature Effects on the apparent viscosity of (F45S55).
Temperature effects on the apparent viscosity of samples is described by means of the Arrhenius equation as:
μ=A1.eEaT
Where µ is the apparent viscosity, Ea is the activation energy for flow, R is the universal gas constant, and T is the absolute temperature.By applying logarithms to both sides of Equation (3) it leads to:
ln(µ)=lnA1+Ea/T
Table (1) shows the relationship between activation energy for soybean oil, partially and fully hydrogenated soybean oil at different shear rates. The results revealed that activation energy didn’t give a good trend for all samples studied. This may be due to that the longer the chain of the fatty acyl groups, the more viscous the oil and the greater the Ea.
Chemical Analysis
- Acid Value
The acid value indicates the amount of free fatty acid present in the oil. It determines the purity of oils. The higher the values, the lower the possibility of the oils to be used for cooking purpose. The results revealed that acid value for different samples was approximately constant as shown in table 2.
|
Table 1. The activation energy for different samples of soybean oil, partially hydrogenated, and fully hydrogenated soybean oil at different shear rates. |
||||
|
|
Activation energy (kJ/mol). |
|||
|
Shear rate |
Soybean oil |
Partially hydrogenated soybean oil |
soybean oil (SO) and fully hydrogenated soybean oil (FHSO) with the ratio |
|
|
|
|
|
F45S55 |
F4S6 |
|
93 |
27691.44 |
29858.9 |
125217.2 |
38335.85 |
|
139.5 |
54572.26 |
38514.61 |
126796.8 |
40403.55 |
|
186 |
109079.7 |
43680.92 |
128293.3 |
41840.21 |
|
200 |
111565.6 |
44983.73 |
129091.5 |
41929.16 |
|
232.5 |
31883.36 |
40578.14 |
129631.9 |
20878.12 |
|
250 |
121949.8 |
49621.28 |
130172.3 |
25183.11 |
|
267.5 |
102819.2 |
50457.67 |
131244.8 |
24885.46 |
|
280 |
147282.5 |
52902.81 |
131702.1 |
47938.52 |
|
320 |
79056.16 |
63152.31 |
133198.6 |
49100.82 |
|
560 |
27691.44 |
69685.45 |
134861.4 |
38335.85 |
|
800 |
54572.26 |
29858.9 |
135767.6 |
40403.55 |
- Peroxide Value
Peroxide value is a measure of extent in which rancidity reactions happen throughout storage. The quality and stability of fats and oils can be indicated by using the peroxide value [14]. The results revealed that peroxide value was the same for F45S55 and F4S6, while the lowest peroxide value was for FH.
- Saponification Number
Saponification value provides information about the average chain length and hence the molecular weight of fatty acid. The shorter the average chain length of fatty acids, the higher the saponification number and the lower average molecular weight of the fatty acids and vice-versa [12]. The results showed that the lowest saponification value was for partially hydrogenated soybean oil followed by F45S55, FH, and F4S6, respectively. The saponification values’ depression may be due to that the molecular weight of fatty acids is low or the number of ester bonds is less. This might imply that the fat molecules did not interact with each other [19].
- Iodine value
Iodine value measures the degree of unsaturation in fetor vegetable oil and determines the stability of oils to oxidation and unsaturation the fat to be determined qualitatively [15]. The results revealed that the lowest iodine value was for partially hydrogenated soybean oil (51.59) then FH, F45S6, and F4S6 respectively, however, the highest iodine value was for soybean oil. The previous research stated that the lower the iodine values, the greater the oxidative storage stability. The oxidative and chemical changes in oils during storage are characterized by an increase in free fatty acid contents and a reduction in total unsaturation [28].
Conclusion
Fully hydrogenated soybean oil and soybean oil with different ratios (40:60 and 45:55) (F4S6 and F45S55), with zero Trans and low saturated fatty acids were used as an alternative to a commercial partially hydrogenated shortening to avoid their bad effects on health. Rheological properties of soybean oil, partially and fully hydrogenated soybean oil were determined using Brookfield Rheometer DVIII Ultra. Also, the effect of temperature on the apparent viscosity of soybean oil partially and fully hydrogenated oil was determined. The lower peroxide value for partially hydrogenated soybean oil, the lowest saponification. Iodine value was for partially hydrogenated soybean oil.
|
Table 2. Oil parameters for different samples. |
||||||
|
Treatments |
Oil parameters |
|
||||
|
|
Peroxide value |
Acid value |
saponification value |
Iodine value |
|
|
|
F45:55 |
13.10± 0.052 b |
0.191± 0.005 a |
190.65± 0.217 a |
77.72± 0.143 c |
|
|
|
F4S6 |
13.06± 0.024 b |
0.180± 0.001 a |
191.28± 0.365 a |
81.67± 0.171 b |
|
|
|
FH |
7.43± 0.052 d |
0.190± 0.009 a |
191.06± 0.190 a |
75.91± 0.147 d |
|
|
|
PH |
10.35± 0.030 c |
0.186± 0.002 a |
181.89± 0.105 b |
51.66± 0.068 e |
|
|
|
Oil |
15.05± 0.026 a |
0.199± 0.010 a |
191.15± 0.191 a |
135.64± 0.115 a |
|
|
|
L.S.D |
0.108 |
0.019 |
0.638 |
0.371 |
|
|
Mean ±standard division of triplicate trials.
Within a column, means having the same superscript letters are not significant at P-value of 1%.
Acknowledgement
We sincerely express our indebtedness to Dr. Mazzanti from dal. University for his kind help and support through the manuscript work.
References
- Connor, W. E. Importance of N-Fatty Acids in Health and Disease, American Journal of Clinical Nutrition, 2000; 71:1715-1755.
- Khayatan, J., Iravani, M., Moghimipour, E., Haghighizade, M. H., Jelodarian, J., Effect of red clover vaginal cream on dyspareunia and sexual satisfaction in postmenopausal women: A triple-blinded clinical trial, Int. j. pharm. phytopharm. res., 2019; 9 (4), 23-9.
- Srivastava, N., Gaurav, K., Biodiesel and its production: renewable source of energy, J Biochem Tech, 2019; 10(3): 1-10.
- Gandomkar, A., The effects of living and non-living mulches on soil chemical properties in apple tree, J Biochem Tech, 2018; (2): 131-135.
- Ivanov, D. S., Lević, J. D., Sredanović, S. A. 'Fatty acid composition of various soybean products, Institute for Food Technology, 21000 Novi Sad, Bulevar cara Lazara 1, Serbia UDC 633, 2011; 34: 577 113.
- Acevedo, N. C., Marangoni, A. G. Characterization of the Nanoscale in Triacylglycerol Crystal Networks, Crystal Growth & Design, 2010; 10 (8):3327-3333.
- Correa, R. Effect of Chemical Interesterification on Physicochemical Properties and Industrial Applications Of Canola Oil and Fully Hydrogenated Cottonseed Oil Blends, Journal of food lipids, 2009; 16(3); 362-381.
- List, G. R., Emken, E. A., Kwolek, W. F., Simpson, T. D., Dutton, H. J., Zero Trans Margarins Preperation, Structure, and Properties of Interesterfication Soybean Oil-Soy Trisaturate Blends, Northern Regional research center, ARS, USDA, 1977; 40.
- Stender, S., Dyerberg, J., Influence of trans fatty acids on health, Ann Nutr Metab, 2004; 48: 61–66.
- Mensink, R.P., Metabolic and health effects of isomeric fatty acids, Curr Opin Lipidol, 2005; 16: 27–30.
- Lemaitre, R. N., King, I. B., Mozaffarian, D., Sootodehnia, N., Siscovick, D. S. Trans-fatty acids and sudden cardiac death. Atherosclerosis Supplements, 2006; 7(2): 13-15.
- Ascherio, A., Stampfer, M. J., Willett, W. C., Trans fatty acids and coronary heart disease, http://www.hsph.harvard.edu/ reviews/transfats.pdf, 1999.
- Clarke, R., and Lewington, S., Trans fatty acids and coronary heart disease - Food labels should list these as well as cholesterol and saturated fat, British Medical Journal, 2016; 333: 7561.
- Manku, M. S., Horrobin, D. F., Morse, N., Kyte, V., Jenkins, K., Wright, S., Burton, J.L. Reduced level of prostaglandin precursors in the blood of atopic patients: defective D-6-desaturase function as a biochemical base for atopy, Prostaglandins Leukot Med, 1982; 9: 615–628.
- Chrysam, M.M. In: Apple white TH, editor. Bailey’s industrial oil and fat products, vol. 3. New York: Wiley; 1985:41.
- Pilar, O.C., Antonia Pérez de los Ríos1, Joaquín Quesada-Medina1*,IOANA STANCIU, Rheological Study Behavior of Soybean Oil,Journal of Science and Arts Year 18, 2011; 44(3): 711-7
- Jones, M. A., Fetter, D., Zidenberg-sherr, S., Nutrition and health info sheet: Trans Fatty Acids, Center for Nutrition in Schools Department of Nutrition, University Of California, Davis, 2016.
- Roche, H. M., Fatty acids and the metabolic syndrome. Proceedings of the Nutrition Society, 2005; 64(1): 23-29.
- American Heart Association 2008.12/11/2016.http://www.americanheart.org/presenter.jhtml?identifier=3036399
- Hoy, H. Y., handbook of edible oils and fats (translated by Fereshteh Malek), 1997.
- Tong W., Jenni L. B., Rheological and Thermal Properties of Soybean Oils with Modified FA Compositions, JAOCS, 2002; 79(8).
- Brookfield manual, Brookfield manual No. M/98-211-B0104 Operating Instructions, Brookfield Engineering Laboratories, Inc. Middleboro, MA. USA, 1998.
- AOAc. In: Official methods and recommended practice of the American Oil Chemist Society, 5th Ed. AOAC Press; 1993.
- Kailas, M. T., Mahajan, D. T. Properties of soybean oil and its belend with petroleum oils, International Journal of Mechanical Engineering &Technology, 2012; (2): 511-517.
- Stanciu, I., Rheological study behavior of soybean oil, Journal of Science and Arts, 2018; 3 (44):711-716.
- Akleshwar, M., Studies on Viscosity of Soybean Oil, International Journal of Engineering Technology Science and Research IJETSR, 2017; 4(9).
- José Ginés H. C., Francisco G. D. B., Viscosity as a Measure of Oil Composition Changes due to Thermal Degradation, Applied rheology, 2014: 1-6.
- Perkin, E. G. Effect of lipid oxidation on oil and food quality in deep frying. In: Angels, AJS (Ed.), Lipid Oxidation in Food, Chapter 18, ACS Symposium Series no. 500 ACS, American Chemical Society, Washington DC. 1992; 310–21.
Contact Meral
Meral Publications
www.meralpublisher.com
Davutpasa / Zeytinburnu 34087
Istanbul
Turkey
Email: [email protected]