Determination of Ertapenem for Pharmacokinetic study
Daniel I. Palma1*, Elena M. Vega2, María N. Gai2
1 Department of Internal Medicine, University of Chile’s Clinical Hospital, University of Chile, Independencia, Santiago, Chile. 2 Department of Sciences and Pharmaceutical Technology, Faculty of Chemical and Pharmaceutical Sciences, University of Chile, Independencia, Santiago, Chile.
Correspondence: Daniel I. Palma, Department of Internal Medicine, University of Chile’s Clinical Hospital, Independencia, Santiago, Chile. Email: dpalma @ hcuch.cl
ABSTRACT
Objective: A simple and rapid HPLC method with UV detection of the unbound concentration of ertapenem was developed for therapeutic drug monitoring (TDM) in the elderly inpatient. Methods: After ultracentrifugation, chromatographic separation of ertapenem in human plasma was achieved at 25°C with a C18 column and a mobile phase compounded by acetonitrile-phosphate buffer pH 6.5, 50 mM (14:86, v/v). Quantitative determination was performed by UV at 310 nm. The method was specific and validated with a limit of quantification of 0.24 mg/L for unbound concentration. Results: The intra- and inter-day coefficients of variation were between 0.56 and 2.32% and the accuracy was between 91.0 and 102.0 %. Ertapenem showed stability in all tests carried out in plasma samples. The performance of the developed method to determine ertapenem in plasma was validated and it was established that it is fast, accurate, precise, and reproducible over a clinically relevant calibration range. Conclusion: The method has been developed and validated for TDM in the elderly inpatient to evaluate the attainment of the pharmacokinetic/pharmacodynamic index of carbapenem antibiotics.
Keywords: HPLC, validation, pharmacokinetic, carbapenem.
Introduction
Ertapenem is a carbapenem antimicrobial agent with a broad spectrum against gram-positive and gram-negative bacteria, frequently used for the treatment of community-acquired or nosocomial infections, including extended-spectrum beta-lactamase (ESBL). One of its advantages is the administration as a once-a-day treatment, due to its high binding to albumin (> 90%). It is excreted predominantly by urine with a half-life varying from 4 hours in young adult volunteers, up to 14 hours in patients with end-stage renal disease. [1] As a bactericidal agent, the most important pharmacokinetic/pharmacodynamic (PK/PD) index predicting in vivo efficacy of ertapenem is the time that the free (or unbound) drug concentration is maintained above the minimum inhibitory concentration of the pathogen, in at least 40% of the administration interval. [2, 3]
However, the physiological aging can change the drug disposition affecting the attainment of the PK/PD index [4, 5] hypoalbuminemia and renal disease are common conditions in the elderly inpatient with multiple comorbidities. [6-8] These factors are the basis for pharmacokinetic variability observed in this population. [9]
Therapeutic drug monitoring (TDM) is a more individualized approach with dosing adapted to the altered pharmacokinetics of the individual patient and is likely to be a strategy that can help optimize dosing in older people. [10]
Therefore, the aim of this study was to develop and validate a chromatographic method for the quantification of ertapenem for TDM.
Materials and Methods
The HPLC system consisted of a Flexar FX-20 LC Pump (Waltham, MA, USA) with a UV/visible detector. The data acquisition and processing were carried out by Chromera Software (Waters, Milford, USA). The chromatographic separation was performed with a Spherisorb C18 column; 4.6 x 250 mm, 5 µm (Waters, Milford, USA) at 25°C using a column oven. The mobile phase was composed of acetonitrile-phosphate buffer (pH 6.5, 50 mM) (14:86, v/v) at an isocratic flow rate of 1 mL/min and an injection volume of 50 µL. The peaks of interest were detected by UV absorbance at a wavelength of 310 nm. The quantification was based on the peak area of ertapenem. Ertapenem was obtained from commercial formulations: Ertapenem sodium (InvanzTM, Merck Sharp and Dohme). Orthophosphate dihydrogen sodium and orthophosphoric acid were of analytical grade and acetonitrile (LiChrosolv, Merck, Chile) was of HPLC grade. All deionized water (18.2 M Ω) was prepared from the Millipore purification system (Bedford, MA, USA). The blank plasma was obtained from the Central Laboratory of the University of Chile’s Clinical Hospital.
The commercial formulation of ertapenem was dissolved in deionized water to obtain 100 mg/mL of reconstituted solution. Then, working solutions were prepared from aliquots of the reconstituted solution with deionized water for each concentration level (Table 1), which were stored in volumes of 10 mL at -80°C.
The mobile phase was prepared by dissolving 6.89 g of sodium dihydrogen orthophosphate in 880 mL of deionized water, adding 120 mL of acetonitrile and adjusting the pH to 6.5 with sodium hydroxide, making the total volume of the mobile phase greater than 1 L. Finally, the mobile phase was vacuum degassed and filtered through a 0.22 µm filter.
From working solutions, different aliquots were taken (Table 2), which were transferred into centrifugation tubes and brought to 5 mL with blank plasma to obtain the following levels of theoretical concentration: 0.24, 1.2, 2.4, 6.0, 9.0.12.0, 36.0, 48.0, and 60.0 mg/L. Quality controls were obtained from different aliquots of working solutions (Table 2), which were transferred into centrifugation tubes and reached to 5 mL with blank plasma to obtain the following levels of theoretical concentration: 3.0, 15.0, and 45.0 mg/L for QCs. Then, aliquots were taken and transferred into centrifugation tubes and stored at -80°C. For stability and recovery test, different aliquots of the working solutions were taken (Table 2), which were transferred into centrifugation tubes and reached to 5 mL with blank plasma to obtain the following levels of theoretical concentration: 3.0 and 45.0 mg/L.
Once calibrator samples, quality controls, samples for recovery, and stability were prepared, an aliquot (200 µL) was transferred into the Vivaspin 500 ® ultrafiltration system and centrifuged for 10 minutes at 15,000 x g at 4°C. Finally, an ultrafiltrate aliquot of 100 µL was obtained and transferred to a vial, vortex mixed for 30 seconds, and placed into an autosampler to continue with the chromatographic analysis.
The method was validated to ensure the results were adequate for its purpose and carried out according to the guidelines developed by the Food and Drug Administration for Bioanalytical Method Validation. [11]
Selectivity was evaluated chromatographically by the absence of interfering peaks, using six individual sources of blank plasma samples.
Linearity of ertapenem was tested by ultrafiltration at nominal concentrations of 0.24, 1.2, 2.4, 6.0, 9.0, 12.0, 36.0, 48.0, and 60.0 mg/L. Each calibrator was prepared in quintuplicate. The concentration-response relationship was fitted to the simplest linear regression model. The calibration curve was made using calibrators at nominal concentration against ertapenem peak area, obtaining goodness of fit parameter (R2) and y-intercept at zero concentration. The percent deviation from nominal concentration was calculated by regression at each concentration of the calibrator with an acceptance criterion of ≤ 15% on the calibration curve.
The limit of quantification (LOQ) was considered as the lowest concentration established in the linearity curve of the system that can be quantified with precision and accuracy. LOQ was validated by replicated plasma analysis enriched with ertapenem at 3.0 mg/L for total concentration and 0.24 mg/L for unbound concentration with a precision ≤ 20% as an acceptance criterion.
For calculation of absolute recoveries of ertapenem, spiked QC samples were prepared by ultrafiltration at low (3.0 mg/L), medium (15.0 mg/L), and high (45.0 mg/L) concentration levels (Table 2). Six replicates of each QC sample were extracted and injected into the HPLC system. The free concentration of ertapenem was determined from the linear regression of the analytical standard curves. The recovery was calculated by comparing the observed concentration with the spiked concentration.
The intra-run and inter-run precision were performed by a five-replicated analysis of the QCs. The concentrations were determined by calibration curves and the precision (% CV) was calculated at each level (low, medium, high). The intra-day precision data were obtained from the intra-day run, while the inter-day data were obtained from separate curves for at least 7 days from each other.
Auto-sampler stability was established using two QCs prepared and extracted in five replicates and stored at 25°C in auto-sampler vials for twelve hours before analysis. These solutions were compared with freshly spiked samples to determine the accuracy and precision using back-calculated concentrations from the original standard curve.
The short-term stability was performed with plasma samples spiked with ertapenem at low and high concentration levels. These solutions were measured at each level, at zero time and after six hours, and injected three samples of each concentration level. Samples were spiked after six hours to obtain accuracy and precision using back-calculated concentrations. Freeze-thaw stability was evaluated using low and high levels of QCs and three cycles of 24 hours of freezing (-80ºC) and thawing. Secondly, twelve samples were processed by concentration level, and the first three samples of each level of QCs should be considered as zero time and the remaining samples were frozen at -80ºC for 24 hours. Finally, each sample was injected in duplicate and this operation was repeated until completing three cycles.
Accuracy and precision were determined using back-calculated concentrations. Stock solution stability was assessed by preparing ertapenem solutions at low and high QC. After the preparation of the samples, each solution was injected in triplicate, and results obtained were considered as time zero. Then, a group of solutions remained at room temperature and the other was refrigerated at -80°C for 24 hours. Once the time was reached, both groups of solutions were injected in triplicate. Finally, this operation was repeated every 48 hours.
Long-term stability was assessed with plasma samples spiked with ertapenem at low and high concentration levels, obtaining eighteen samples for each level of concentration. All of them were processed using three samples for each level of concentration in each different time. The first time was considered as zero time, and three samples of each level were processed and injected once each. After a lapse of 168 hours, the samples were thawed at room temperature (25ºC) and processed in triplicate at each concentration level, injecting once per sample. This process corresponded to week 1 and was repeated until completing five weeks. The coefficient of variation was determined at each level (≤15%), as well as the relative error, considering zero time as 100% and whose value should be between 85 - 115%.
Results and Discussion
The chromatographic separation of ertapenem and interfering peaks were suitable under established conditions respect to the mobile phase and wavelength, shown in the blank plasma sample peak (Figure 1a). Additionally, Figure 1b presents the plasma sample processed by ultrafiltration with ertapenem spiked at 2.4 mg/L. The typical retention time is described in Table 3.
All calibration curves and its parameters were adequately described by linear regression over the concentration range (Table 3), included R2, equations, range of calibration, and %CV at LOQ. All standards met the acceptance criteria and none was rejected from the calibration curve in the concentration range analyzed. The average precision of the LOQ was 1.29%, with an acceptance criterion of <20% (Table 3). The intra-run and inter-run analyses in triplicate of the QCs at low, medium, and high levels of concentrations are presented in Table 4 and all the results were acceptable with a standard deviation from nominal concentration by no more than 5%. The overall recovery process was based in freshly quality control samples at low, medium, and high concentration ranged between 98.8 - 100.6%. The results of the evaluation of the short-term stability, by cycles of freeze/thaw, long-term and in auto-sampler stability are shown in Table 5. The results were suitable for the working stability of ertapenem in the experimental conditions. All tests met the criteria of accuracy and precision established.
In this manuscript, we described the development and validation, in accordance with FDA guidelines, of a rapid, precise, and accurate stability indicating an isocratic reversed-phase HPLC method for analysis of unbound ertapenem in human plasma. In addition, calibration curves were adequate according to the linear regression over the clinically relevant range assessed.
In this context, one of the main differences between this work and previously published methods was that in our study, no stabilizing buffer was used for the ultrafiltrate. Other authors considered that the use of this buffer would avoid the degradation by hydrolysis of ertapenem in the sample and would help to fix the pH to 6.5. [12] In the present work, authors considered the use of stabilizing buffer unnecessary because, in different stability tests, the samples proved to be stable for adequate storage and processing times.
The analytical advantages of this method are suitable for the development of TDM programs, particularly for the elderly who requires a less invasive sampling process with low volume samples. [13, 14] Moreover, the determination of the unbound concentration of ertapenem can be adequate for stability tests, reducing sample preparation procedures, and analysis time compared to other available methods. [15-17]
Ertapenem has a non-linear plasma protein binding, which means that the free fraction is not constant in the concentration range used. In addition, some factors that could affect the determination of plasma protein binding, including temperature, have been described. In the present study, the ultrafiltration temperature was 4°C because ertapenem reaches an approximate binding to albumin of 90%; therefore, the free fraction is 10%, which does not appear to change significantly up to 25°C. [18]
Conclusion
The development of a method for drug monitoring needs to provide accurate and precise results in a fast, reliable, and easy way. From a laboratory and clinical perspective, this method is advantageous because the analytical instrumentation is relatively commonplace compared to mass spectrometry detection. Additionally, the technique required an isocratic mobile phase and it was not necessary to use an internal standard as in other works, due to the high recovery obtained. The performance of the developed method has been proven by validation and we concluded that it is reliable for TDM programs in the elderly inpatient.
Acknowledgment
Some assays of this work were supported by Consejo Nacional de Ciencia y Tecnología de Chile (CONICYT; project number: 21120174) and Oficina de Apoyo a la Investigación Clínica (OAIC 698-14) from University of Chile’s Clinical Hospital.
Conflicts of interest
None.
References
- Zhanel G, Wiebe R, Dilay L, Thomson K, Rubinstein E, Hoban DJ, Noreddin AM, Karlowsky JA. Comparative review of the carbapenems. Drugs. 2007; 67(7): 1027 – 1052.
- Nix DE, Matthias KR, Ferguson EC. Effect of ertapenem protein binding on killing bacteria. Antimicrobial Agents and Chemotherapy. 2004; 48(9): 3419 – 3424.
- Musson DG, Majumdar A, Holland S, Birk K, Xi L, Mistry G, Sciberras D, Muckow J, Deutsch P, Rogers JD. Pharmacokinetics of total and unbound ertapenem in healthy elderly subjects. Antimicrobial Agents and Chemotherapy. 2004; 48(2): 521-524
- Nguyen TD, Nguyen TT. Determining the effect of aging on the burden of diseases in Vietnam. Arch. Pharm. Pract. 2020;11(1):109-13.
- Khojah SM. The Relationship between the Sirtuins and Slowing the Aging. J. Biochem. Technol. 2019;10(2):51-
- Khan SS, Singer BD, Vaughan DE. Molecular and physiological manifestations and measurement of aging in humans. Aging Cell. 2017; 16(4): 624 – 633.
- Wahab Amjad M, Abdul Ghafoor Raja M. Synthesis and Characterization of Albumin Microparticles as Carriers for Antibiotic Levofloxacin. Int. J. Pharm. Phytopharm. Res. 2018;8(5):80-3.
- AlSogair AA, Alharbi AA, Alharbi SH, Alateeq FA, Aloriney AM, Ahmed HG. Knowledge and Perceptions Toward Chronic Kidney Disease Prevention and Control in Saudi Arabia. Int. J. Pharm. Res. Allied Sci. 2019;8(1):77-83.
- Carlier M, Stove V, Wallis SC, De Waele JJ, Verstraete AG, Lipman J, Roberts JA. Assays for therapeutic drug monitoring of ß-lactam antibiotics: A structured review. International Journal of Antimicrobial Agents. 2015; 46(4): 367-375.
- Muller E, Huttner B, Huttner A. Therapeutic drug monitoring of beta-lactams and others antibiotics in the intensive care unit: which agents, which patients and which infections? Drugs. 2018; 78(4):439-451.
- US Department of Health and Human Services, Food and Drug Administration. Bioanalytical Method Validation: Guidance for Industry. Rockville, MD. 2018; pp 1-44.
- Musson DG, Birk KL, Cairns AM, Majumdar AK, Rogers JD. High-performance liquid chromatographic methods for the determination of a new carbapenem antibiotic, L-749,345, in human plasma and urine. Journal of Chromatography B: Biomedical Sciences and Applications. 1998; 720(1-2): 99 – 106.
- Natishan T, Sajonz P. Acetate and chloride determination by ion exchange HPLC with indirect photometric detection and its application to a β-methylcarbapenem antibiotic. Journal of liquid chromatography & related technologies. 2007; 24(17): 2583 – 2599.
- Mody L, Miller DK, McGloin JM, Freeman M, Marcantonio ER, Magaziner J, Studenski S. Recruitment and retention of older adults in aging research. Journal of the American Geriatrics Society. 2008; 56(12): 2340 – 2348.
- Pickering M, Brown S. Quantification and Validation of HPLC-UV and LC-MS Assays for Therapeutic Drug Monitoring of Ertapenem in Human Plasma. Biomedical Chromatography. 2013; 27(5): 568 – 574.
- Pedroso TM, Salgado HR. A critical review of analytical methods for determination of ertapenem sodium. Critical Reviews in Analytical Chemistry. 2016; 46(1): 15 – 21.
- Pickering M, Brown S. Assays for determination of ertapenem for applications in therapeutic drug monitoring, pharmacokinetics and sample stability. Biomedical Chromatography. 2014; 28(11): 1525 – 1531.
- Musson DG, Birk KL, Kitchen CJ, Zhang J, Hsieh JY, Fang W, Majumdar AK, Rogers JD. Assay methodology for the quantitation of unbound ertapenem, a new carbapenem antibiotic, in human plasma. Journal of Chromatography B. 2003; 783(1): 1 – 9.
|
Table 1: Preparation of ertapenem working solutions and calibrators. |
|||
|
Reconstituted solution |
Aliquot |
Water |
Working solutions |
|
(mg/L) |
(µL) |
(µL) |
(mg/L) |
|
100000 |
120 |
9880 |
1200 |
|
100000 |
100 |
9900 |
1000 |
|
100000 |
48 |
9952 |
480 |
|
1200 |
1000 |
9000 |
120 |
|
Working solution |
Aliquot |
Plasma |
Calibrator |
|
(mg/L) |
(µL) |
(µL) |
(mg/L) |
|
1200 |
250 |
4750 |
60 |
|
1200 |
200 |
4800 |
48 |
|
480 |
125 |
4825 |
36 |
|
480 |
37.5 |
4962.5 |
12 |
|
1200 |
25 |
4975 |
9 |
|
1200 |
10 |
4990 |
6 |
|
1200 |
50 |
4950 |
2.4 |
|
120 |
25 |
4975 |
1.2 |
|
120 |
10 |
4990 |
0.24 |
|
Table 2: Summary of sample preparation for quality controls, stability test, and recovery. |
|||
|
Quality control (QC) |
|||
|
Working solution |
Aliquot |
Plasma |
QC |
|
(mg/L) |
(µL) |
(µL) |
(mg/L) |
|
1000 |
225 |
4775 |
45 |
|
1000 |
75 |
4925 |
15 |
|
1000 |
15 |
4985 |
3 |
|
Recovery (REC) |
|||
|
Working solution |
Aliquot |
Plasma |
REC |
|
(mg/L) |
(µL) |
(µL) |
(mg/L) |
|
1000 |
225 |
4775 |
45 |
|
1000 |
75 |
4925 |
15 |
|
1000 |
15 |
4985 |
3 |
|
Stability (ST) |
|||
|
Working solution |
Aliquot |
Plasma |
ST |
|
(mg/L) |
(µL) |
(µL) |
(mg/L) |
|
1000 |
225 |
4775 |
45 |
|
1000 |
15 |
4985 |
3 |
|
Table 3: Chromatographic conditions and parameters of the calibration curve. |
||||
|
tr (min) |
Range of calibration (mg/L) |
Equation |
R2 |
%accuracy/ %CV at LOQ |
|
3.26 |
0.24 – 60.0 |
y = 79992x + 8828 |
0.9922 |
86/0.85 |
tr: retention time; R2: goodness of fit; %CV: coefficient of variation; LOQ: limit of quantification.
|
Table 4: Accuracy and precision for quality controls measured within-run (n=10) and between-run (n=10). |
|||||
|
Intra-day mean (%accuracy/%CV) |
Inter-day mean (%accuracy/%CV) |
||||
|
3 mg/L |
15 mg/L |
45 mg/L |
3 mg/L |
15 mg/L |
45 mg/L |
|
91/3.12 |
102/2.32 |
99/0.62 |
92/0.83 |
102/2.55 |
99/0.56 |
%CV: coefficient of variation.
|
Table 5: Summary of precision and accuracy results of quality controls for the stability study. |
|||||||
|
Short-term stability (6 h) (%accuracy/%CV) |
Freeze/thaw stability (-80°C) (%accuracy/ %CV) |
Long-term stability (%accuracy/%CV) |
Auto-sampler stability (24 h) (%accuracy/%CV) |
||||
|
Low |
High |
Low |
High |
Low |
High |
Low |
High |
|
90/0.16 |
93/0.39 |
98/0.24 |
96/0.15 |
94/0.95 |
93/0.32 |
99/0.47 |
94/1.28 |
%CV: Coefficient of variation
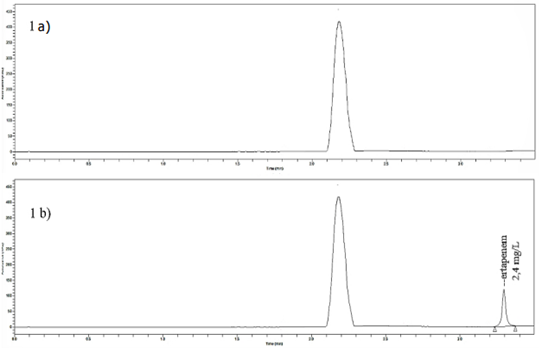
Figure 1: Chromatographic detection at 310 nm for blank plasma peak (1a) and ertapenem peak at 3.26 min (1b).
Contact Meral
Meral Publications
www.meralpublisher.com
Davutpasa / Zeytinburnu 34087
Istanbul
Turkey
Email: [email protected]