
The indicator system of regional socio-economic situation based on harmonized information resources
Natalia Alekseevna Sadovnikova1*, Olga Gurievna Lebedinskaya1, Alexander Valerievich Bezrukov1, Leysan Anvarovna Davletshina1
1Depertment of Statistics, Institute of Mathematics and Digital Economy, Plekhanov Russian University of Economics, Moscow, 117997, Russia.
Correspondence: Natalia Alekseevna Sadovnikova. Sadovnikova; Plekhanov Russian University of Economics, Moscow, 117997, Russia. [email protected].
ABSTRACT
Digitalization of methods of obtaining information, a variety of forms of statistical reporting are often accompanied by the emergence of methodological problems in the evaluation of certain indicators. The creation of a digital statistical double of the subject, based on the principles of harmonization of information resources, will optimize the depth of data provided by individual departments, take into account the specifics of the development of individual territories and factors that have a quantitative and qualitative impact on the institutional environment. This study presents an improved methodology for analyzing the level of banking services provision in the subject and its economic health, taking into account the requirements of the formation of the digital shadow of the region. The relevance of such an analysis is related to the problem of achieving the necessary predictive significance, which is possible only when applying statistics at the regional level. The presented system of indicators contains not only data on the level of basic banking services of the subject, but also the grouping of subjects for each component of the model, which is especially important for dynamic analysis. The possibility of using statistical data aggregated by such doubles. The complex nature of the methods allowed us to identify the characteristic features of the development of the regions, their "bottlenecks". Dynamic analysis of the cluster composition allowed us to identify the features of individual clusters and give recommendations for their further development.
Keywords: Digital economy, Economic health of region, Index of banking services provider, Information resources
Introduction
The development of the digital economy requires the formation and development of so-called digital twins (DT) and digital shadows of real objects (subjects or regions) [1].
The creation of multi-level resource constraints and target matrices based on such digital twins is often accompanied by a conflict between the parameters and characteristics of an object as a whole and its components, which raises the problem of harmonizing the methodology for the collection and presentation of statistical survey results and their optimality [2, 3].
Such statistical twins become an essential component of national wealth, knowledge-based economy, and sociology. The lack of a common concept for the information and statistical support for management decisions, a unified methodology, and technologies for the creation and development of GIS and AIS, opacity of sources and methodologies used by departmental and regional statistics are cumulatively contributing to the poor quality of statistical data. On the one hand, users lack figures, cuts, and the speed with which statistical information is provided; on the other hand, businesses suffer from the excessive burden of providing statistical information and the need to complete statistical reporting forms.
The deviation from centralization («the vertical of power») in the development of the methodology of data collection and reporting leads at least to conflicts of departmental, federal and regional statistics, at worst - to data gaps. The harmonization of the depth of the specific requests of departmental statistics and the already well-known all-Russian forms of statistical information collection is a key issue. The problem of «cheap» statistical data becomes equally important. The solution to two mutually exclusive tasks - «fast statistics=loss of quality» and «output statistics=growth of business burden» - is the digitization of statistical data. How respondents report and surveys are conducted is changing dramatically, so that the solution to the problem goes in the form of unified methodological supervision, ensuring the interoperability of indicators.
Three types of indicators are frequently used to integrate various indicators of the digital development of regions: general, binary, and quantitative indicators accumulated by different agencies. For example, to assess the economic health of Russian subjects and the degree of bank endowment, data generated by four departments are needed: The Russian Federal State Statistics Service, Central Bank of the Russian Federation, Ministry of Finance, and Ministry of Economic Development. Data collection and processing significantly slows the speed of analysis. The formation of a single public information resource containing information on all forms of federal, departmental, municipal statistics, accounting, tax and other reporting, observation and monitoring, statistical indicators, administrative data collected and developed by the authorities and administrations at all levels and performing as a «one-stop-shop» would certainly alleviate the problem.
The relevance of the “Digital Shadow of a Region” determined the purpose of the research - to tailor the indicator system of the regional socio-economic situation to the requirements of comparability of data based on harmonized information resources.
Theoretical basis
The digital twin of a region is its virtual prototype, a set of digital information about the region that is constantly updated and self-taught. The analysis of such a digital twin should indicate the critical characteristics that need to be further monitored (e.g. per capita GRP, per capita federal budget subsidy, etc.) or those «gaps» for which aggregated information is either not available or there are any institutional contradictions. The formation of a digital twin effectively shifts the focus to the process of generating content data, forming Smart Big Data.
Unlike a digital twin, a digital shadow can only predict the behavior of a real object under the conditions in which big data is collected, however, not allowing to simulate situations, where the real object/product has not yet been used - the digital shadow has only a "memory property". Informational-diagnostic digital twins ensure the monitoring and analysis of incidents, any irregular behavior of the subject, i.e. the algorithm operates: object - indicators - big data - predictive analytics. An example of a digital shadow is the indicative observation of regional economic health.
Materials and Methods
At the preparatory stage, the authors made an inventory of the statistical reporting forms to form a system of indicators for measuring regional economic health and its banking services [4, 5].
The resources at www.gks.ru and www.fedstst.ru were used as the information base, as well as available collections of the Institute of Statistical Research and Knowledge Economy of National Research University - Higher School of Economics and internet-portals of departmental institutions.
The use of digital twins for statistical analysis makes it possible to increase the reliability of the data and reduce the variability. A digital twin brings together social indicators in a single complex.
Whereas previously most of the well-known macroeconomic indicators were used to measure the economic development of a country as a whole and its stakeholders in particular (GDP, M2 aggregate, inflation, debt-to-GDP ratio, bank deposits to GDP, interest-rate spreads, etc.), this is now clearly insufficient. The implementation of the goals of national projects and the development plans of certain Russian territories is not simply about economic growth, but about the growth of a certain quality. The need to reallocate funds has led to the suppression and distortion of market incentives in certain regions. The achievement of the necessary predictive significance is possible only with the application of statistics at the regional level.
The possibilities of using regional digital twins to form an indicator system of the regional socio-economic situation are examined in two examples: 1) the “economic health” clustering of Russian subjects; 2) the “banking services” grouping of Russian subjects. Both frameworks are based on the application of sub-indices.
The formation of the “economic health” integral indicator is based on the calculation of six sub-indices that characterize the different sides of the estimated regional economic activity [6].
It is proposed that the indicator be defined as follows (1):
|
|
(1) |
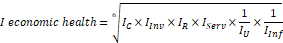
IC-  local index of an increase in construction works (estimated as the chain growth rate of the index «Volume of works carried out by the economic activity «Construction» per capita of the population living at the territory of a Russian subject);
IInv – index of investment in fixed capital (estimated as the chain growth rate of the indicator «Investment in fixed capital by Russian subjects» per capita of the population living at the territory of a Russian subject);
IR – retail turnover index per capita;
IServ - index of the total of paid services rendered to the population
IU – unemployment indexes;
IInf – index of inflation rates.
Each of the selected indices has been adjusted by the corresponding average for Russia. Other statistics were rejected as marginal.
The analysis and estimation of the banking services of Russian regions were carried out using the adjusted methodology of the Bank of Russia based on sub-indices [7].
The analysis of the provision of banking services to the subjects was carried out based on the adjusted methodology of the Bank of Russia. The reason for the need for such adjustments is associated with its shortcomings [7]. In the proposed model, the authors corrected several deficiencies. In particular, it is proposed to evaluate loans granted to individuals based on the population size of a Russian subject entity, rather than GRP per capita [8]. However, the assessment of institutional endowments should involve the GRP indicator of a region, rather than its population.
Also, the presented scorecard not only provides data on the subject’s level of basic banking services but also a grouping of subjects for each component of the model, which is particularly important for dynamic analysis.
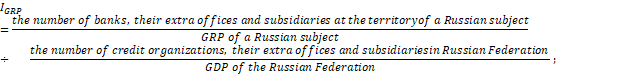
The calculation of the aggregate index for the subject’s banking services is based on eight sub-indices, each of which, as in the previous model, is based on local data (2):
|
|
(2) |

|
|
(3) |

IGRP - index of the provision with banking services, which is calculated as the ratio:
|
|
(4) |
IА - index of the financial provision with banking services by assets, which is calculated as the ratio:
|
|
(6) |

 – index of the financial provision with banking services provided to legal entities, to GRP, which is calculated as the ratio:
|
|
(7) |

Respectively:
|
|
(8) |

 -index of financial savings, which is calculated as the ratio:
|
|
(9) |

 - index of paid services:
|
|
(10) |

Results and Discussion
The use of regional digital twins in a statistical analysis provides the most accurate and reliable information on its development. The analysis of the models showed this clearly.
The improved methods for estimating regional provision with banking services and regional economic health are aimed at strengthening the regional component in the calculation of sub-indices. The indices of banking institutional endowments per GDP, financial provision with banking services calculated as the total of credits to individuals per capita, the net assets of credit organizations allowed to look differently at the previously formed distribution «periphery-center». For most regions, the analysis found a close direct relationship with the Bank Services Index. The wider the range of banking services in the region and the higher their total, the more likely is the high level of regional development. When the object of the study is changed from subjects to agglomerations, the assessment of economic health becomes more variable [9].
Institutional Endowment Index, Financial Endowment by Population Index by Volume of Loans by Individuals, Financial Endowment by Banking Services Index by Population of Region, and Estimation of Equity (Capital) Index credit organizations allowed to look differently at the previously formed distribution «peripheral-center».
The analysis of the level of economic health revealed the static nature of the values of local indices for the period under study (2015-2018). The distribution of subjects in the ranked series has remained practically unchanged.
For example, for two indices - the local construction growth index (IC)  and the fixed investment index (IInv)
 - the sustainable leaders over the last three years have been the remote regions: Khanty-Mansi and Yamalo-Nenets Autonomous Okrugs, Sakhalin and Magadan Oblast, the Republic of Sakha. Such a position of most leaders in the general rating is explained by the status of «oil-producing» subjects. The leading positions of Chukotka Autonomous Okrug in construction are associated with the implementation of state programs. Federal cities Moscow and Saint Petersburg were not included in this group in absolute terms, but the dynamics of their changes are positive.
Unexpected results were obtained when evaluating the retail turnover index (IR) . It was revealed that the presence of the dynamics of the development of the network of branches of credit institutions in the region is more significant for retail trade than the level of monetary income of the population.
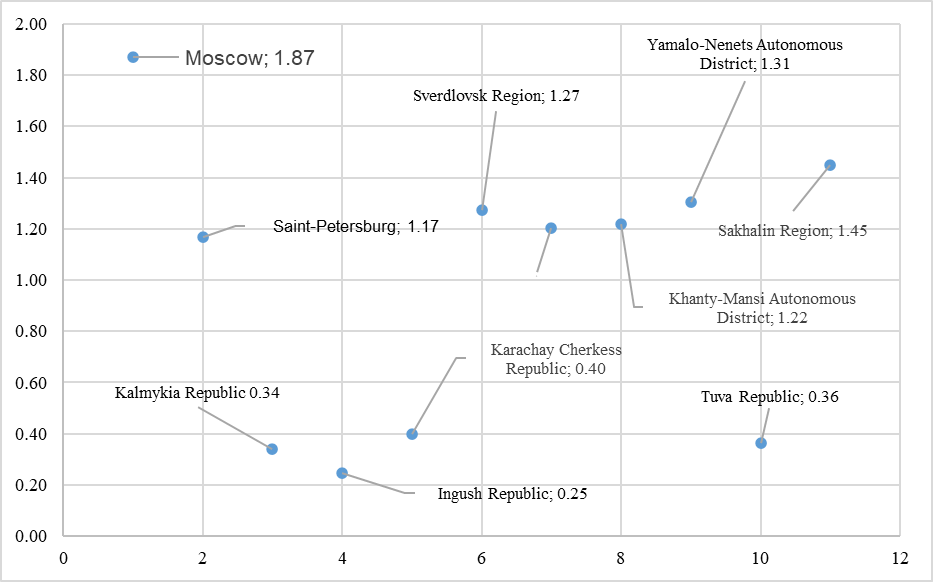
The degree of this correlation depends on the subject's ability to respond to an increase or decrease in consumer demand. However, the pattern of economic growth and decline varies from region to region. The preliminary data of Rosstat show that according to the results of 2020, the rate of growth of retail trade turnover (according to the calculation method proposed by the authors) of the leading regions is slightly lower than that of outsiders (Kalmykia, Ingushetia, the Karachay-Cherkes Republic) [10]. Similar results were obtained for the index of the total of paid services rendered to the population (IServ ). The high performance of federal cities (Moscow and Saint Petersburg) is explained by their economic and political status. The spread of leaders and outsiders is shown in Figure 1.
|
|
|
Figure 1. Scatter diagram of the retail turnover growth index for the leaders and outsiders |
Two other local indices, the Unemployment Growth Index (IU)  and the Inflation Index (IInf)
  make a significant adjustment. The correlation between inflation and unemployment predicted for the short-term period of the Phillips curve has proved highly unstable in almost all the regions of the North Caucasus region. In most of the above-mentioned Russian subjects, the level of unemployment and inflation was higher than the Russian average. Signs of stagflation in the short term in a region have certainly influenced the aggregate assessment of its economic health. Another «falling» out of the normal distribution is the group of so-called «satellites» of large agglomeration centers. Most of them are in the Volga Federal District. The asymmetries caused by the uneven spatial development increase the attractiveness of the prospective centers of economic growth primarily by increasing their competitiveness, but also «provoke» investment unattractiveness of regional satellites. On the one hand, both the agglomeration and the prospective centre of economic growth are so-called «growth points», impacting the development of both the agglomeration itself, the territorially close municipalities, and the region as a whole, that is expected to lead to economies of scale, lower costs, more efficient territorial management. On the other hand, the concentration of resources in the prospective centre of economic growth will become a factor in the increase of imbalanced social and economic development within the macro-region, «draining» of the population from remote territorial units, weakening traditional historical, sociocultural characteristics of individual territories of a region. In the deeply depressed regions (the Republics of Mari El, Buryatia, Khakassia, and Altai, as well as in the Saratov and Kurgan oblasts), the problems are systemic, and all the local indices considered earlier have minimal values. This is not surprising, because, for example, in 2019 the Republic of Mari El accumulated 16 percent of all state grants to the Volga-Kama region, the Kurgan region - 61.6 percent of the Urals-Siberian region, the Saratov Region - 22.7 percent of the entire Volga-Ural region.
The influence of the local inflation index was most vividly manifested in the territory of raw material and extractive entities. The inaccessibility and low population density stimulate a more significant increase in prices than in the central regions.
|
|
|
Figure 2. Dynamics of the indicator of the economic health for federal districts |
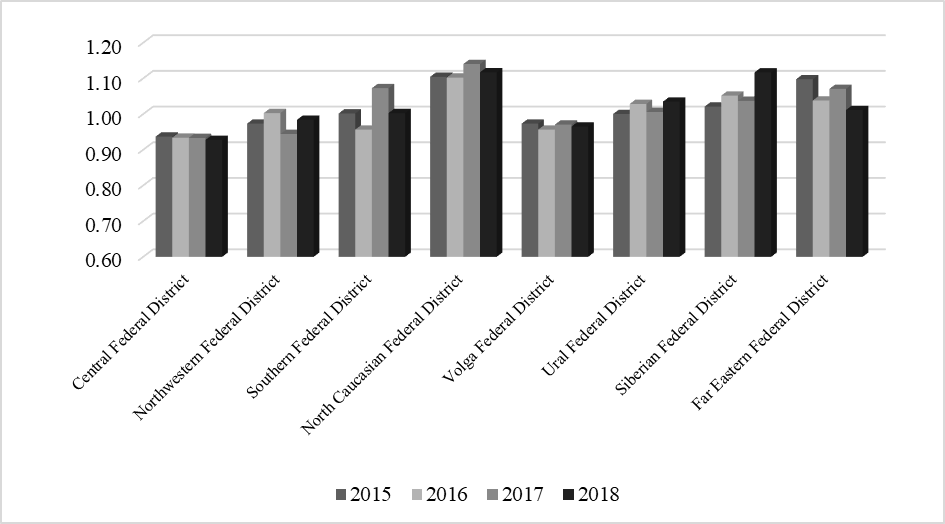
The existing and previously rather contradictory distribution of subjects in these indices over four years (from 2015 to 2018) has only increased, which in turn has influenced the formation of the aggregate index (Figure 2).
The Republics of Tuva, Ingushetia, Kalmykia, and Chechnya, as well as the Zabaykalsky Krai and the Kurgan region, were the group of regions with low economic health indicators. For the latter two subjects, it should be noted that there has been a positive trend in the values of the aggregate index, but it is too early to discern such a reason for growth as a “low base of comparison”. The three leaders throughout the study period remain unchanged: Moscow, Sakhalin, and the Tyumen Oblast.
Assessment of the dynamics of indicators revealed that over four years the asymmetry in the distribution of subjects is only increasing (from 0.08 in 2015 to 0.12 in 2018), the slope of the distribution curve also increases (from 2.21 to 3.18), the composition of the groups remained practically unchanged.
It was also revealed that when the research object is replaced (if we move from the regional level to agglomerations), the values of the economic health indices become more variable. In the context of federal districts, the spread of the obtained values is lower but remains significant. Leaders (Ural Federal District) and outsiders (Northwestern Federal District) of the rating are unchanged (Figure 3).
|
|
|
Figure 3. Dynamics of the values of the index of the provision of banking services for federal districts |
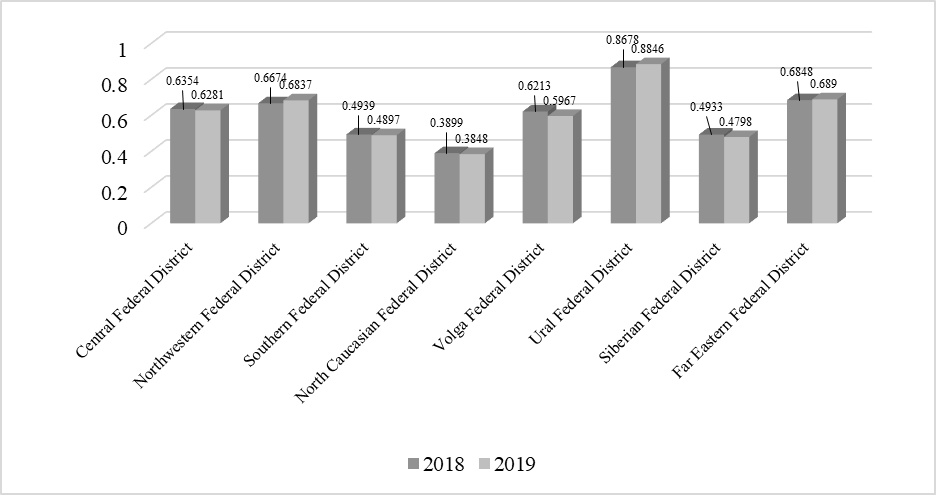
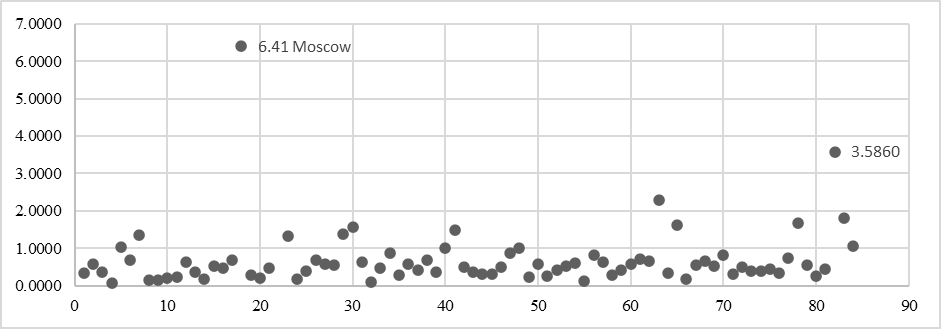
The impact of the subindices is uneven. The dispersion diagram of the institutional provision of banking services (by population) (IIE ) (Figure 4) shows the degree of penetration of banking services into the regional market. As can be seen from Figure 4, the Moscow region stands out significantly on this indicator. However, if the same assessment is made, but in terms of the GRP of a region, the distribution of regions is fundamentally different. Therefore, the model includes analytical blocks, which are most often considered separately, thus breaking the holistic view of the development of the crediting mechanism of the regional economy. It has been found that the evolution of the institutional provision of banking services in terms of GRP (IGRP)
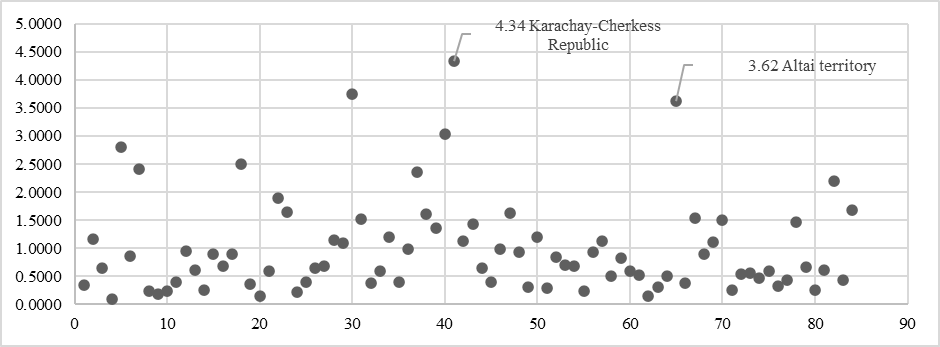
  is largely determined by the degree of the banking sector’s integration in the enterprise chain of a region, which, in turn, has a multiplier effect and is characterized by an increase in aggregate demand for products and services. This is what Figure 5 shows.
|
|
|
Figure 4. Scatter diagram of the values of the index of banking institutional endowments |
|
|
|
Figure 5. Scatter diagram of the values of the index of the provision with banking services |
The index of financial provision of banking services by assets (IA ) and the index of financial provision of banking services by capital (IC)
 are significantly influenced by the degree of state participation. If the nominal share of banks with state participation is generally insignificant (24 banks, 3.9%), then the share of assets of such banks at the beginning of 2017 reached 59%, while 244 regional banks account for only 1.3% of all assets. This may indicate a sharp decline in the role of regional banks in the country's banking system.
The contribution of the index of the financial provision with banking services provided to legal entities, to GRP is no less significant ( . The abundance of banking services in regions has generally increased, but there are exceptions. In many remote regions of the Far East Federal District, the situation has worsened. Analysis of the regional distribution by the index of the provision of banking services by the total amount of loans to legal entities revealed that the group of leaders includes two types of entities with opposite motivations: for the first group, the attraction of credit is necessary for the further development of a successful business (Moscow, St. Petersburg), for the second group (depressed, subsidized entities), credit funds are necessary for "survival" (the Karachay-Cherkess Republic and the Republic of Mari El). A separate group is made up of the regions of the Far East, and the availability of banking services for lending capital to legal entities, which is already very low, has only declined.
High values of the financial provision with banking services in terms of the amount of credit of individuals (  in remote entities (the Nenets Autonomous Okrug, the Khanty-Mansiysk Autonomous Okrug, the Yamalo-Nenets Autonomous Okrug, the Sakha Republic, the Magadan Oblast, and the Sakhalin Oblast) are explained by two reasons: the relationship between the developed commodity sector, which provides for higher incomes for citizens and the cost of living, and the policies of banks, which have facilitated access to credit for citizens.
Thus, according to the data of banki.ru, the Yamalo-Nenets Autonomous Okrug (478,000 rubles) is the leader in total credits per capita. Next are the Khanty-Mansiysk Autonomous Okrug (445,000 rub), Yakutia (389,000 rub), and the Nenets Autonomous Okrug (359,000 rub). Part of the reason for this trend is not so much the increase in the number of banking services, but rather the decrease in the population in these regions.
The highest level of savings (ISav) is found in two federal Okrugs – the Central Okrug and the Volga Okrug. In almost all regions of these Okrugs (except the Bryansk and Kursk oblasts), the values of the financial savings index are higher than one, which shows an increase over the average Russian indicators: the Tver Oblast (1.17), Moscow (1.41) the Moscow Oblast (1.15), the Voronezh Oblast (1.22), the Ryazan Oblast (1.15).
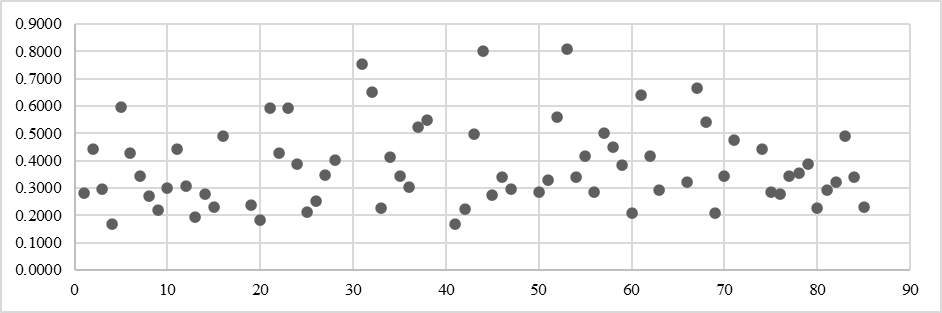
The high value of the coefficient of variation of the values of the index of the provision of banking services (IServ) (0.763) indicates the need to analyze the dynamics of its modal value, which amounted to 0.1757 (for comparison, in 2018 the modal value was 0.2227). Compared to the previous period (2018), both the peakedness (E = 9.33) and the right-sided asymmetry increase (Figure 6).
|
|
|
Figure 6. Scatter diagram of the aggregate index for the subject’s banking services in 2019 |
The study showed that the rating of the regions according to this index is rather static. Leaders and outsiders practically did not change during the study period. The values of the indicator may depend on the agglomeration development of the territory, proximity to the capital (for example, low values of the index in the Voronezh region, despite the presence of the status of a key center of economic development, are caused precisely by this factor), time lag (from the moment of the provision of borrowed funds to reaching the design capacity and it can take a long time to get a contribution to the formation of the regional GRP).
The study revealed that the level of provision of banking services significantly affects the behavior in the field of finance in general. The relationship with the indicator of the economic health of the subject is defined as moderate. The authors propose to distinguish four types of regions. The first group is represented by the so-called “regions-centers of profit,” characterized by a significant agglomeration attraction, with a high level of per capita income and a significant propensity to save (type I).
The second group includes regions with high rates of income differentiation, export-oriented specialization, and often insufficiently developed infrastructure due to difficult natural and climatic conditions. Citizens are trying to maintain the achieved consumption standards during the crisis, which increases the debt on loans (type II).
The third group, the most numerous and difficult to differentiate, is formed by the central regions with an average level of income and moderate debt load; this group also includes economically depressed subjects, but with a moderate level of debt load (type III).
The fourth group included the subjects in which the national culture and the habit of keeping savings at home, based on it, have a significant influence on making financial decisions. The credit system is poorly developed, few banks, due to the lack of money-back guarantees, are reluctant to provide them (type IV).
For comparison, according to the author's method of calculating the index of the provision of banking services, values were obtained for two countries, the USA and Canada. In the United States, regional differentiation turned out to be even stronger (coefficient of variation 1.97), also accompanied by right-sided asymmetry, which leads to a significant decrease in modal values (0.31 and 0.37, respectively). The analysis of interquartile distances revealed the presence of two outliers - these are the states of Delaware and South Dakota, which is associated with the peculiarities of the regulatory regulation of registration of new businesses. In Canada, two opposing trends have been identified. On the one hand, there is a decrease in provincial differentiation in the level of provision of banking services (coefficient of variation 0.147 in 2018 and 0.133 in 2019), on the other hand, a decrease in the modal value of the index from 0.495 to 0.471 in 2019.
Conclusion
Generalization and systematization of scientific publications allow asserting that three types of indicators are often used to integrate various indicators of the digital development of regions: general indicators, binary and quantitative ones. As an example, two complex indices were used: the level of the economic health of the regions and the provision of banking services.
Acknowledgments: None
Conflict of interest: None
Financial support: This study was carried out as a part of a state task in the field of scientific activity of the Ministry of Science and Higher Education of the Russian Federation on the topic “Development of a methodology and software platform for building digital twins, intelligent analysis and forecasting of complex economic systems”, project number is FSSW-2020-0008.
Ethics statement: Authors are aware of, and comply with, best practice in publication ethics specifically with regard to authorship (avoidance of guest authorship), dual submission, manipulation of figures, competing interests and compliance with policies on research ethics. Authors adhere to publication requirements that submitted work is original and has not been published elsewhere in any language.
References
1. AL-Shakhshir SM, Sulaiman SA, Alhaddad MS, Ismail MP. Assessment of the Effectiveness of a Pharmacist-Led Digital Educational Program on Knowledge, Perception, and Practice of Pregnant Women at a Tertiary Care Teaching Hospital. Arch Pharm Pract. 2019;10(1):5-11.
2. Borovkov AI, Ryabov YuA. Digital Doubles: Definition, Approaches and Development Methods. In: The Collection: Digital Transformation of the Economy and Industry. Proceedings of the Scientific-Practical Conference with Foreign Participation; 2019. pp.234-45.
3. Auzan AA, Komissarov AG, Bakhtigaraeva AI. Sociocultural Limitations of the Commercialization of Innovations in Russia. Econ Policy. 2019;14(4):76-95.
4. Algahtani FD. Healthy Lifestyle among Ha'il University Students, Saudi Arabia. Int J Pharm Res Allied Sci. 2020;9(1):160-7.
5. Ren-Zhang L, Chee-Lan L, Hui-Yin Y. The awareness and perception on Antimicrobial Stewardship among healthcare professionals in a tertiary teaching hospital Malaysia. Arch Pharm Pract. 2020;11(2):50-9.
6. Zaernyuk VM. Analysis of methodological approaches to assessing the degree of provision of banking services in the regions of Russia. In International scientific-practical conference "Topical issues of socio-economic development in the context of modernization", Saratov, Russia. 2011.
7. Dyachenko O, Rodova N. Assessment of the provision of banking services in the regions. Bank Rev. 2013;10:27.
8. Aminova FI. Improving the methodology for assessing the provision of a region with banking services. Bull Saint Petersburg State Univ. 2014;8(70):70-2.
9. Holford WD. The future of human creative knowledge work within the digital economy. Futures. 2019;105:143-54.
10. Masood Mir M, Khan S, Tunio M, Omer M, Sajid S, Hussain S. Relationship Between Leadership Styles On Talent Retention Through Employee Commitment And Motivation: Evidence From The Banking Sectors, Pakistan. J Organ Behav. 2019;4(2):34-53.
Contact SPER Publications
SPER Publications and
Solutions Pvt. Ltd.
HD - 236,
Near The Shri Ram Millenium School,
Sector 135,
Noida-Greater Noida Expressway,
Noida-201301 [Delhi-NCR] India